Returns

us.jpg   fr.jpg

When the Russell 2000 is down 30% or worse since 1979

69.png

Earnings growth and S&P 500 total returns for each decade since 1930

68.png

When the S&P 500 is down 25% or worse since 1950

67.png

Starting yields vs. 10-year annual returns for 10-year treasuries: 1928-2021

66.png

Aggregate bonds YTD total return (%)

62.png

Bull and bear markets returns and duration since 1926

61.png

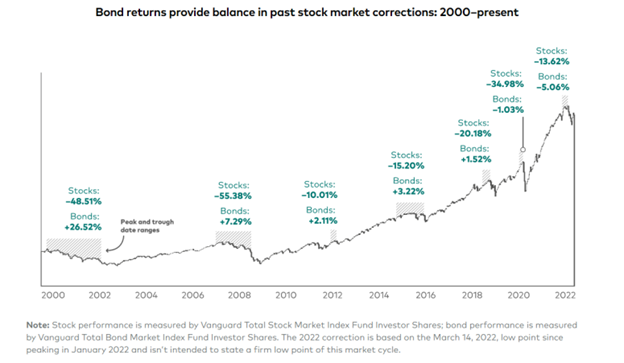
US stocks vs. bond returns 1926-2022

59.png

When the S&P 500 is down 25% or worse since 1950

56.png

S&P 500 annualized returns and the growth of $10,000 over 20 years (2001-2021)

55.png

10-year yield vs. dollar annual rates of change since 1971

48.png

Syndicate content