Returns

us.jpg   fr.jpg

Ratio of the growth of a dollar for small cap value vs small cap non-value (January 1963-June 2023)

image027.png

Ratio of the growth of a dollar for small cap vs large cap (June 1926-June 2023)

image026.png

EAFE vs US Returns since 1970

image023.png

MSCI EAFE vs MSCI USA since 2003

image022.png

MSCI EAFE growth – value (1 year) since June 2004

image018.png

Annualized rolling ten year relative total return of growth vs. value since 1988

image017.png

Total return components of the Bloomberg U.S. aggregate index (%)

image014.png

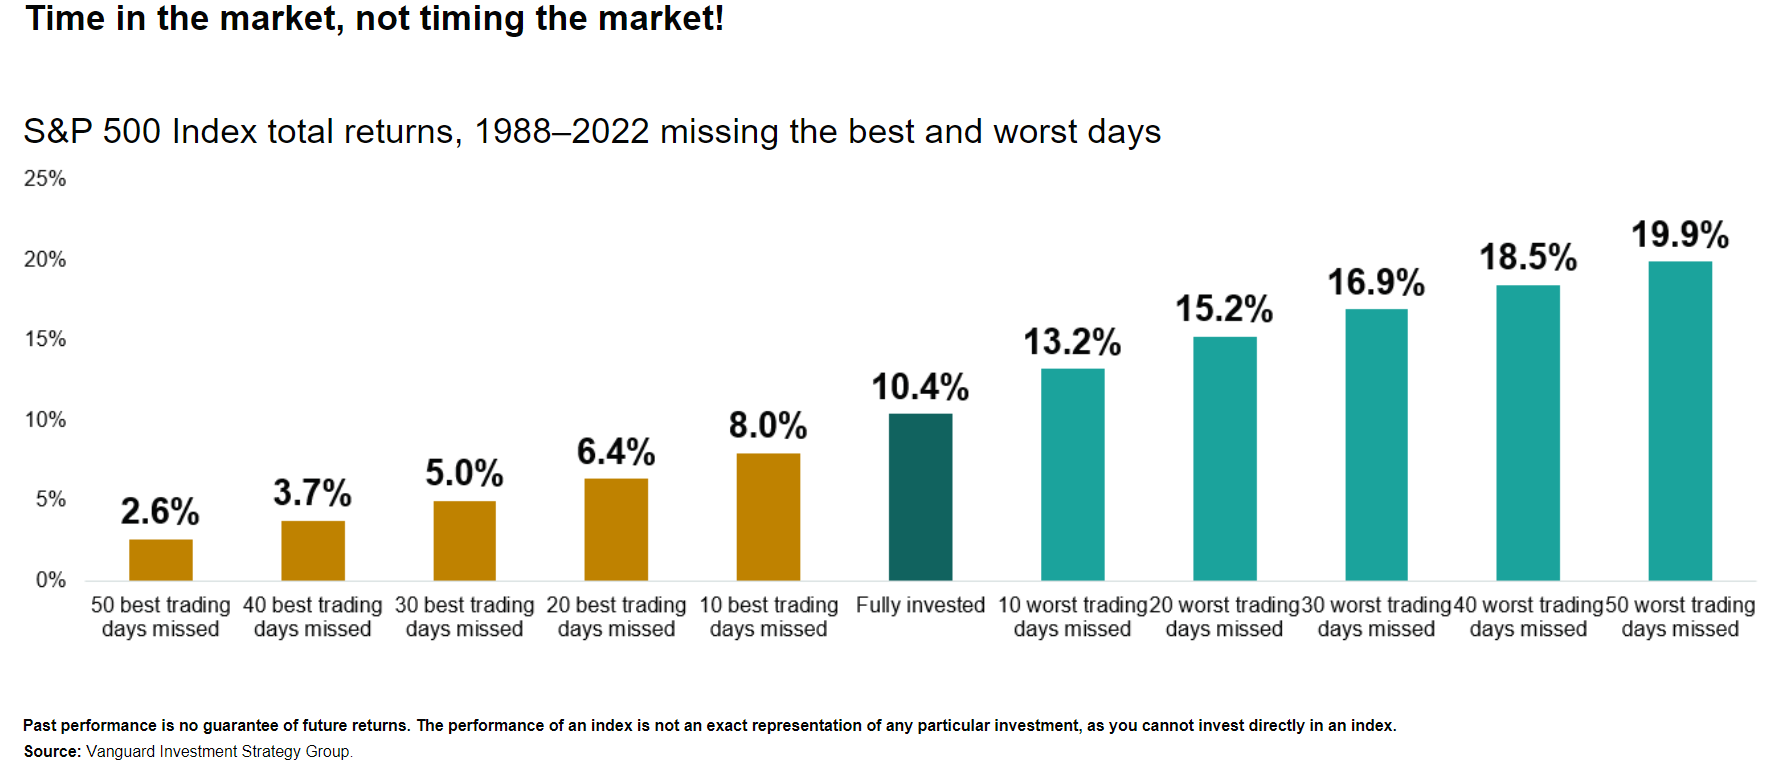
The cost of timing the market: value of $10,000 invested in the S&P 500 Jan 2003-Dec 2022

image010.png

S&P 500 Annual Returns: 1928-2023

image008.png

Morningstar's 30-year asset-class return assumptions improved following 2022

image004.png

Syndicate content