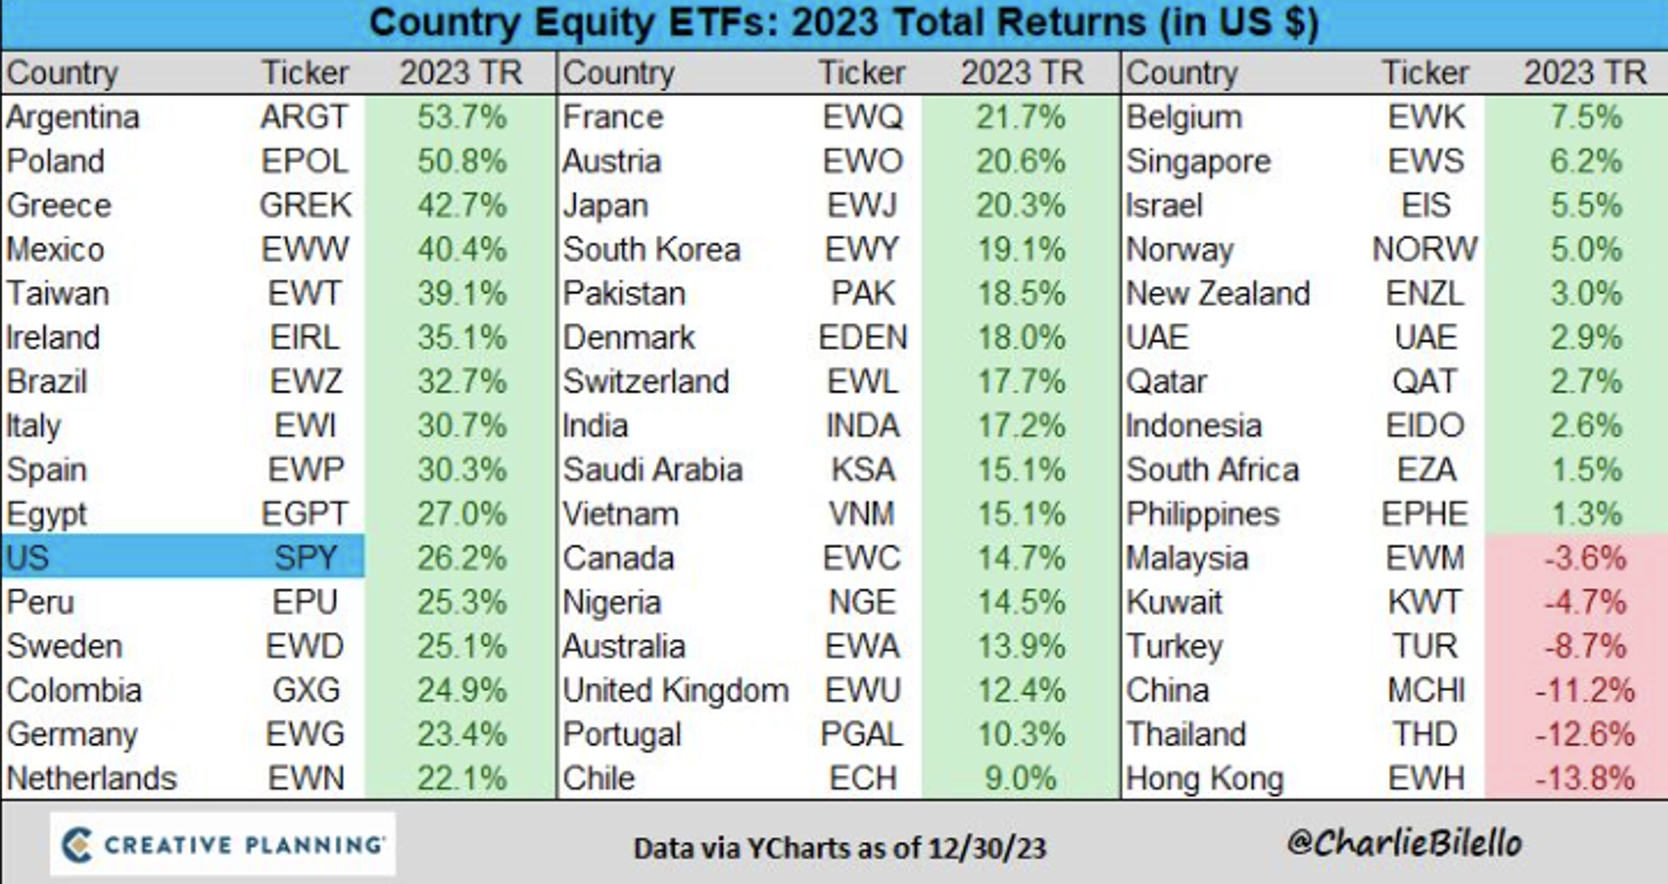
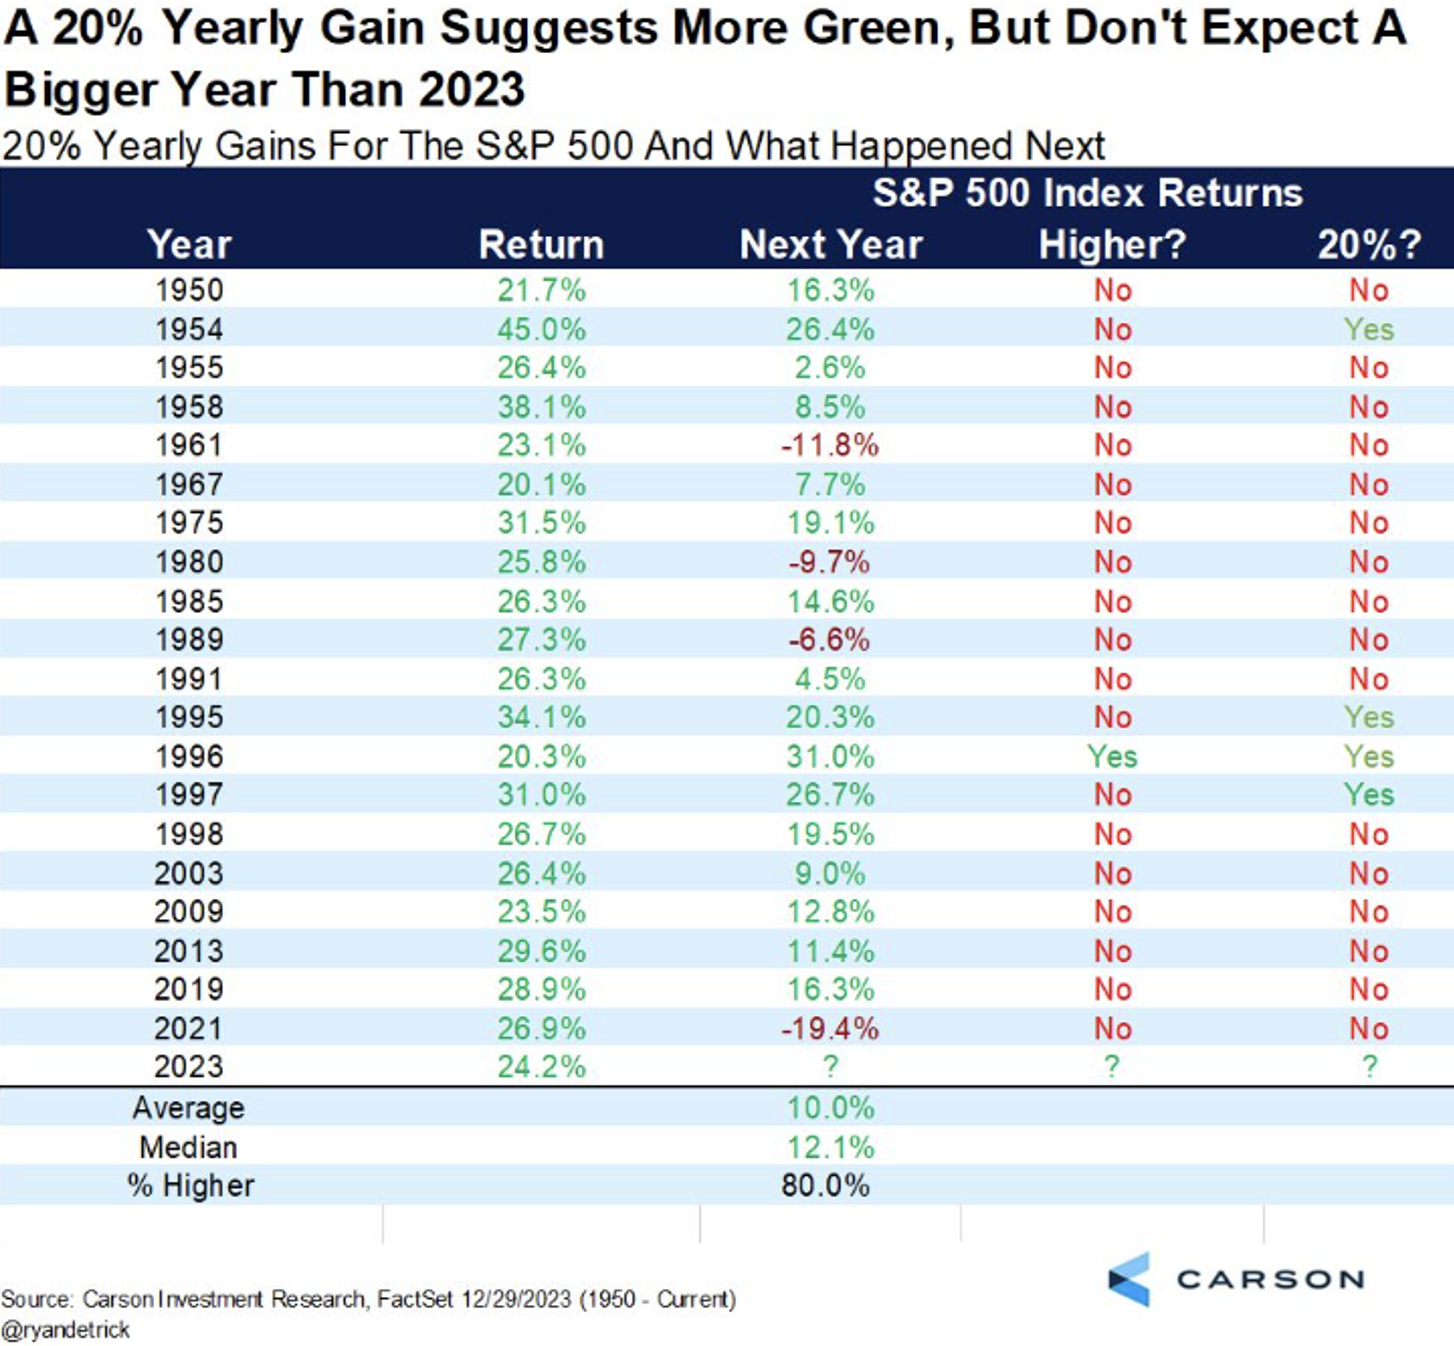
Returns

us.jpg   fr.jpg

Asset Class Total Returns (YCharts 2011-2023)

1.png

In the long run, stock prices go up since 1824

Picture23.png

U.S. Small Cap VS. U.S. Large Cap Since 2000

Picture22.png

U.S. Small Cap Quality Performance Since 1976

Picture20.png

7-Year Asset Class Real Return Forecasts

Picture18.png

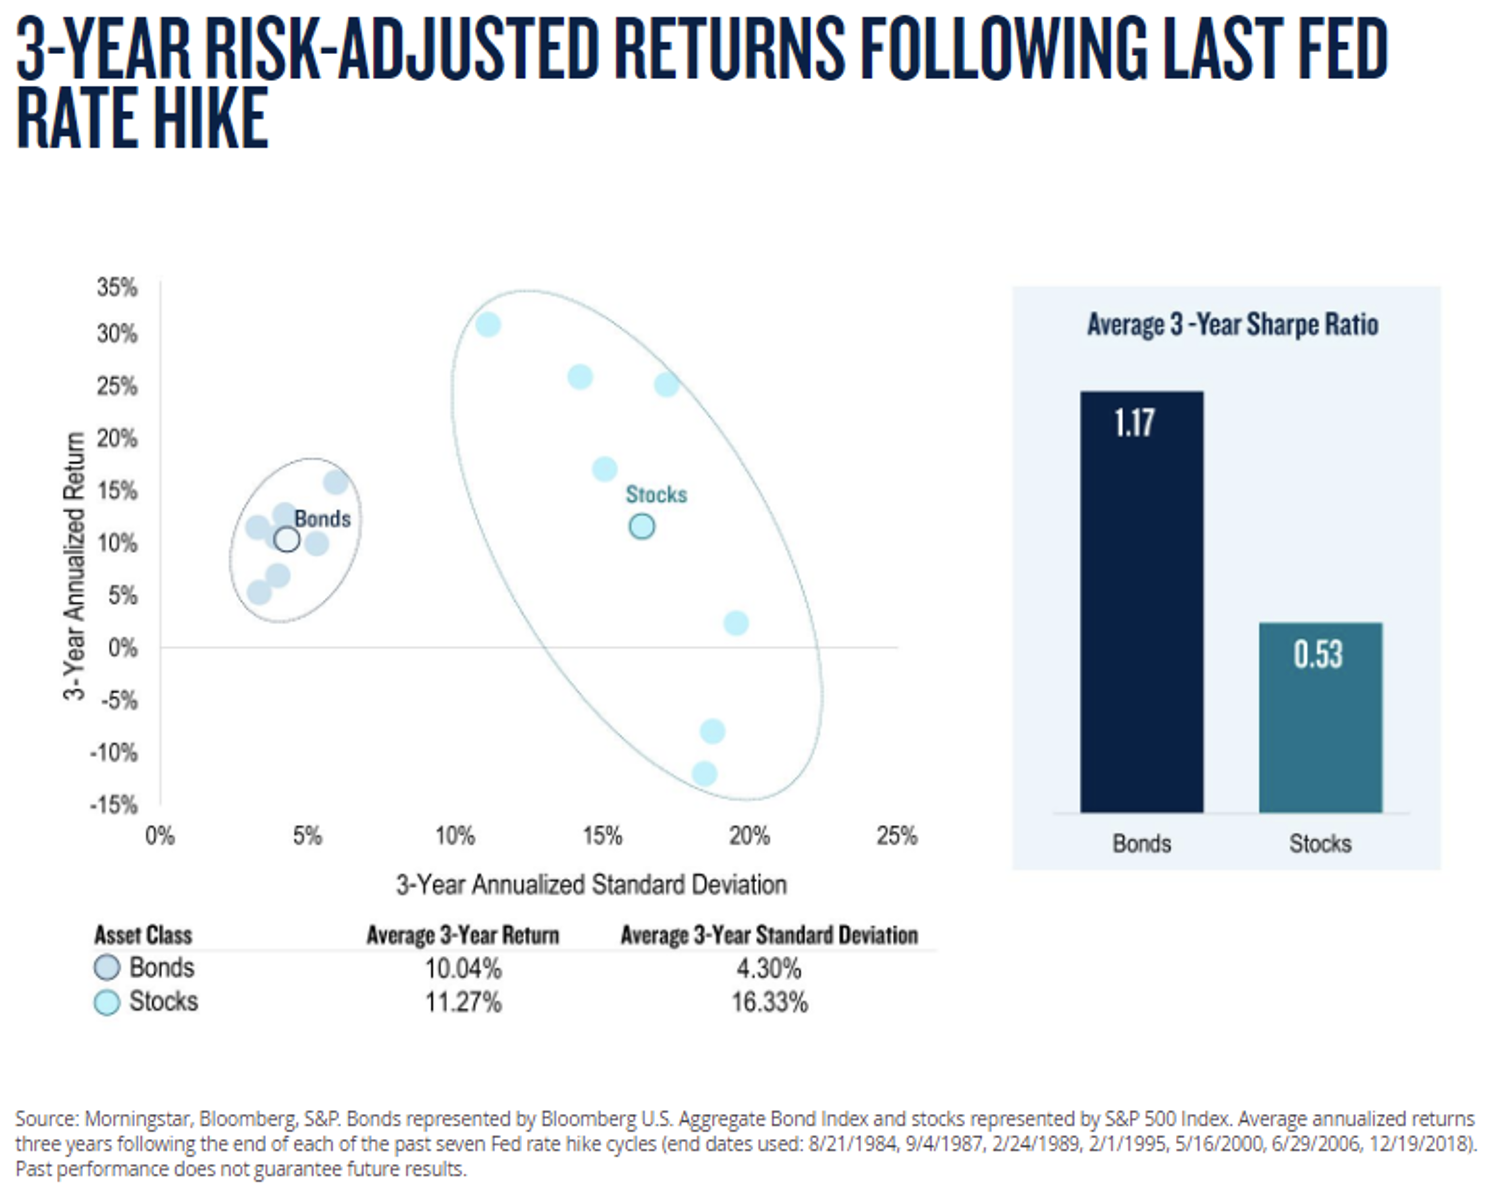
Total Returns Across Fixed Income Following Fed Peaks

Picture2.png

High Trading Cost Also Impact Returns

Picture1.png

Long-Term Bonds Worst Returns (1950-1981)

image025.png

Rolling 10-year US Stock Returns since 1914

image021.png

Syndicate content