info@bourbonfm.com (+1) 312 909 6539
http://tinyurl.com/bfm-interest-rate
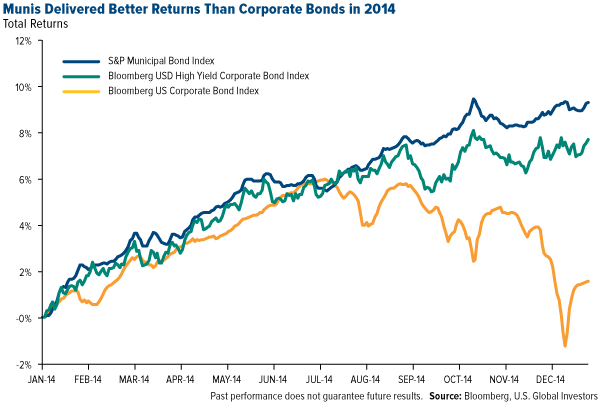
In this newsletter, we discuss interest rates and address the concerns of investors arising from historical low interest rates, the Fed’s ending of Quantitative Easing, and an environment of potentially rising interest rates later this year.
Copyright © 2026 Bourbon Financial Management, LLC. All rights reserved.