Returns

us.jpg   fr.jpg

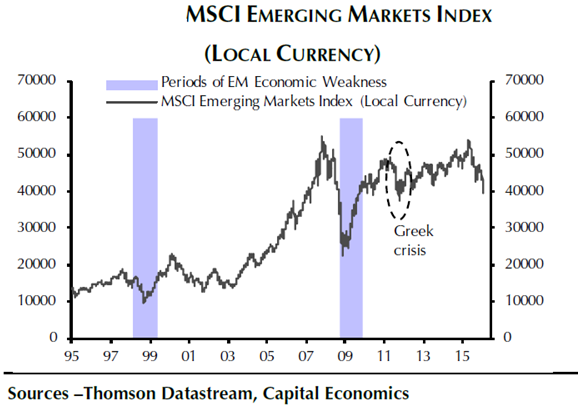
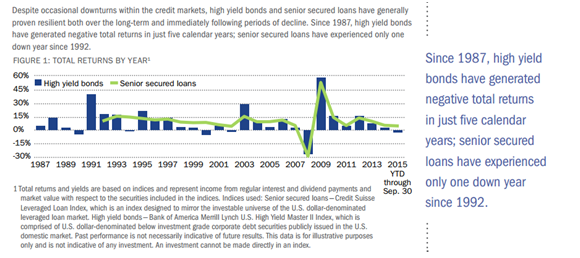
Market Returns

chart 12.png

US is the "Real" High Yielder

chart 5.png

Active Management has Fared Better During Corrections

Chart20.png

Active Managers Have Generally Outperformed in High Dispersion Markets

Chart19.png

Large Blend Funds: No Clear Winner in Active vs. Passive

Chart18.png

Global Mutual Fund And Exchange Traded Fund Flows to Active and Passive Equities

Chart16.png

U.S. Nominal GDP (YoY) % Change vs. 10-Year U.S. Treasury Yields

Chart41.png

Negative Bond Returns in Perspective

Chart32.png

Global Mutual Fund and Exchange Traded Fund Flows to Active and Passive Fixed Income

Chart6.png

Few Funds Avoided Three Consecutive Years of Unperformance

Chart5.png

Syndicate content