Returns

us.jpg   fr.jpg

Interest Rate Regimes Classified by Inflation Environment Since 1951

5.png

Opportunity Costs of Missing Market Performance: $1000 Invested

4.png

91 Year return History for Common Stocks Since 1926

3.png

5 Year Returns on the S&P 500 for 18 periods Since 1927

2.png

Average Sector Historical 30-Days Correlation Against the S&P 500

1.png

Longest Bull markets Since 1942

Longest bull markets.png

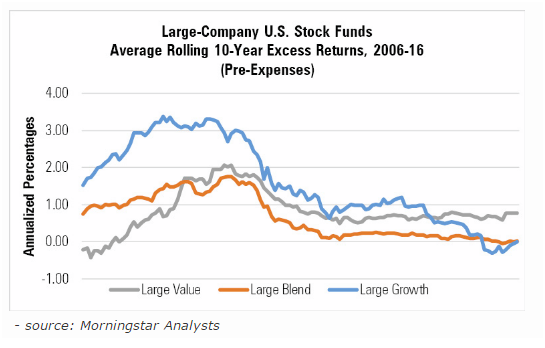
Actively Managed Large Blends vs Passively Managed Large Blends

active and passive outperformnace trends.png

Active Large Blend Category vs S&P 500 Index Funds Since 1985

Actively managed funds.png

Average Returns and Volatility of actively managed funds vs their Markets

Avg returns and volatility.png

Syndicate content