Returns

us.jpg   fr.jpg

MSCI World index progression over last 50 years

95.png

US Treasury 10-Year bond yields

101.png

Rolling 5-year return differential: U.S. stocks - International stocks

93.png

U.S./ Europe Relative Strength (total returns)

92.png

Average stock fund investor return vs. average stock fund return

90.png

Shiller P/E ratio projects a 6.7% 10-year return vs. the average of 10.9%

83.png

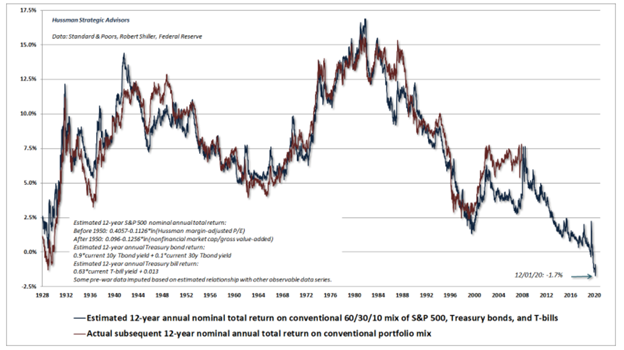
Future returns are heavily dependent on starting valuation

87.png

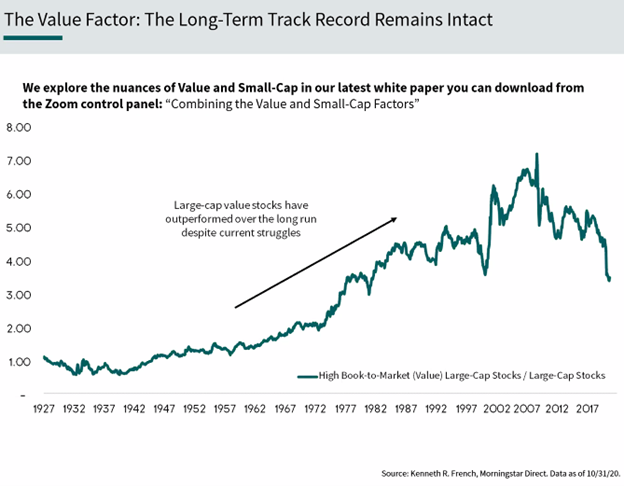
Value outperforms during recoveries

69.png

Visualizing 200 years of US Stock Market History

25.png

Interest Rates Can Remain Low For A Long Time

10.png

Syndicate content