Charts for a better perspective
The BFM team wishes you and your families a Happy, Healthy, Prosperous, and Fulfilling New Year!
Charts to Give You a Better Global Perspective After the Worst December
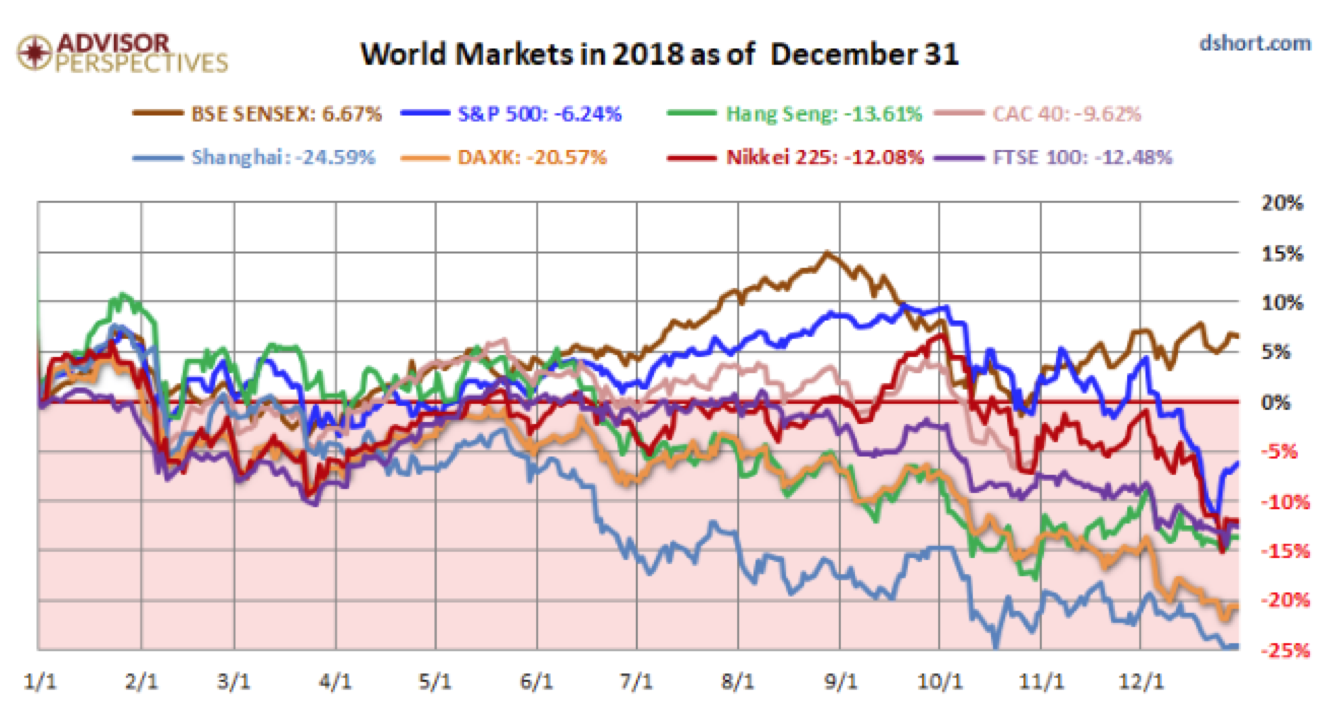
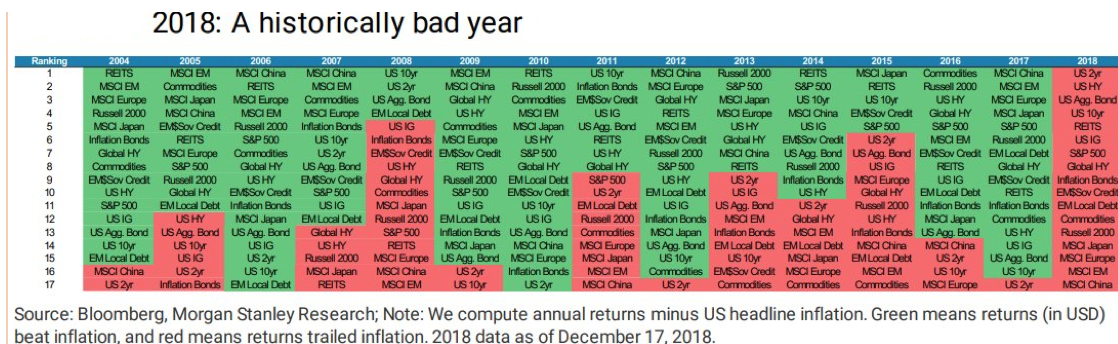
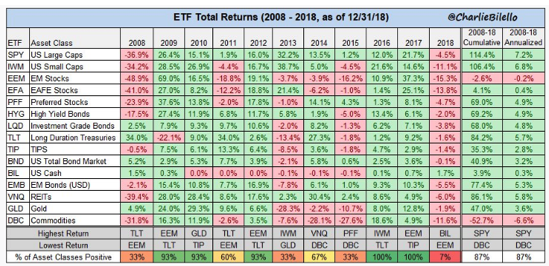
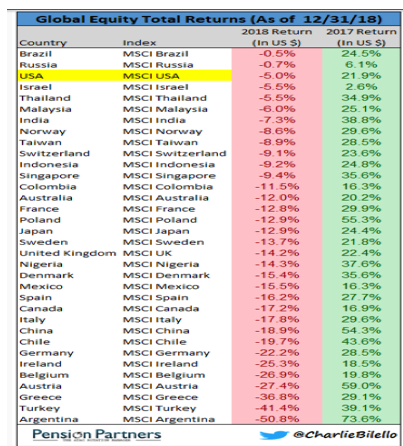
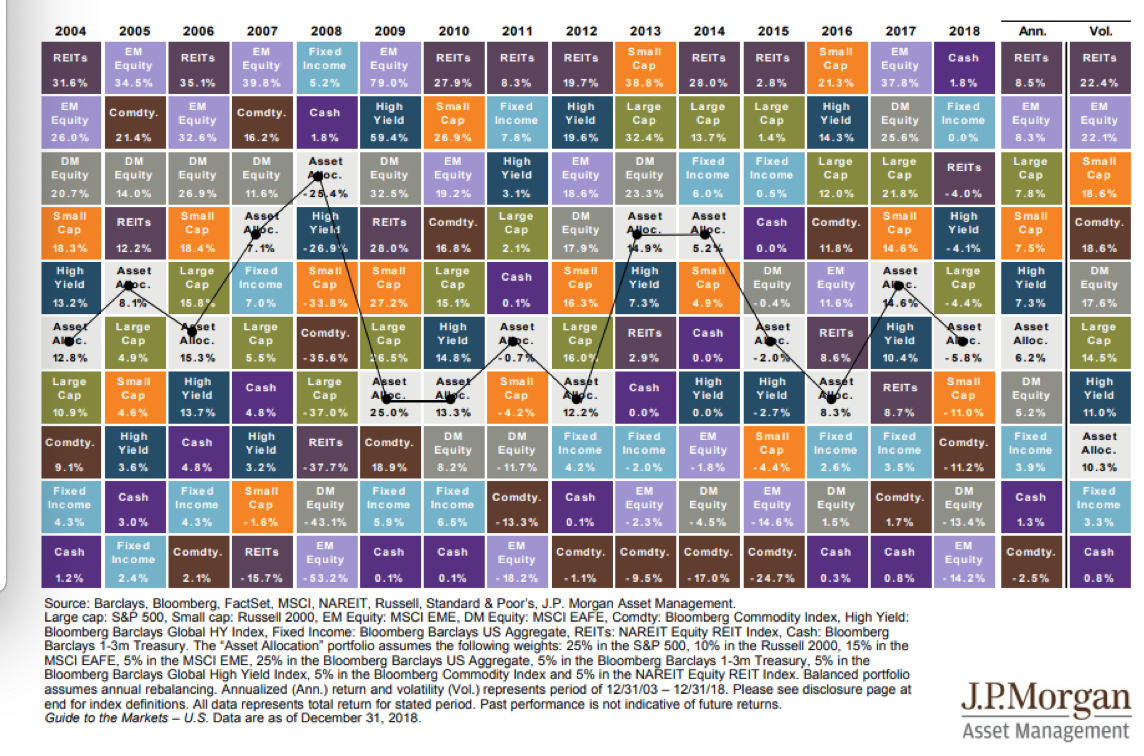
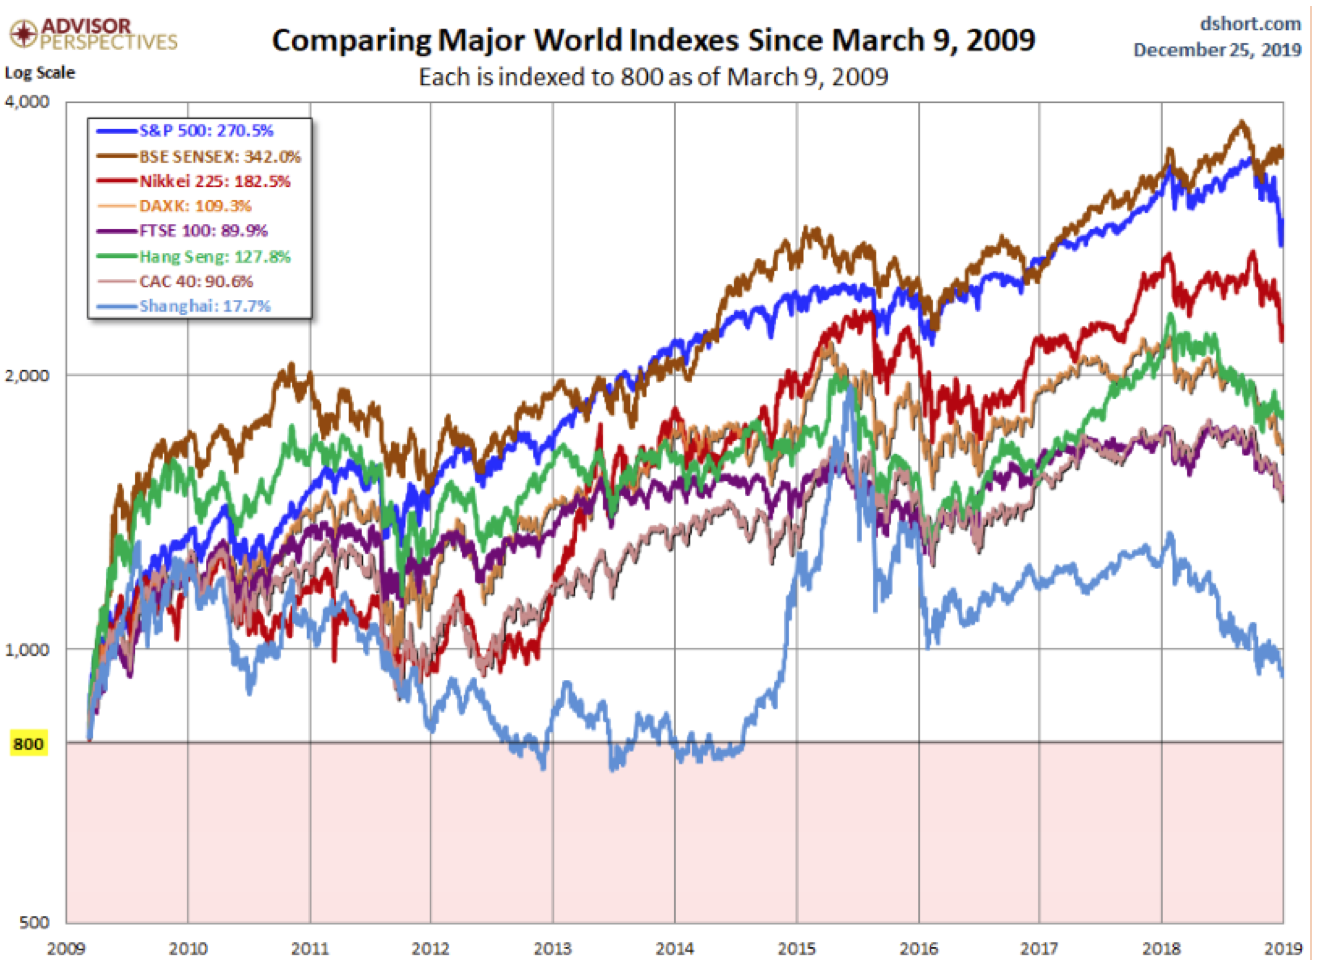
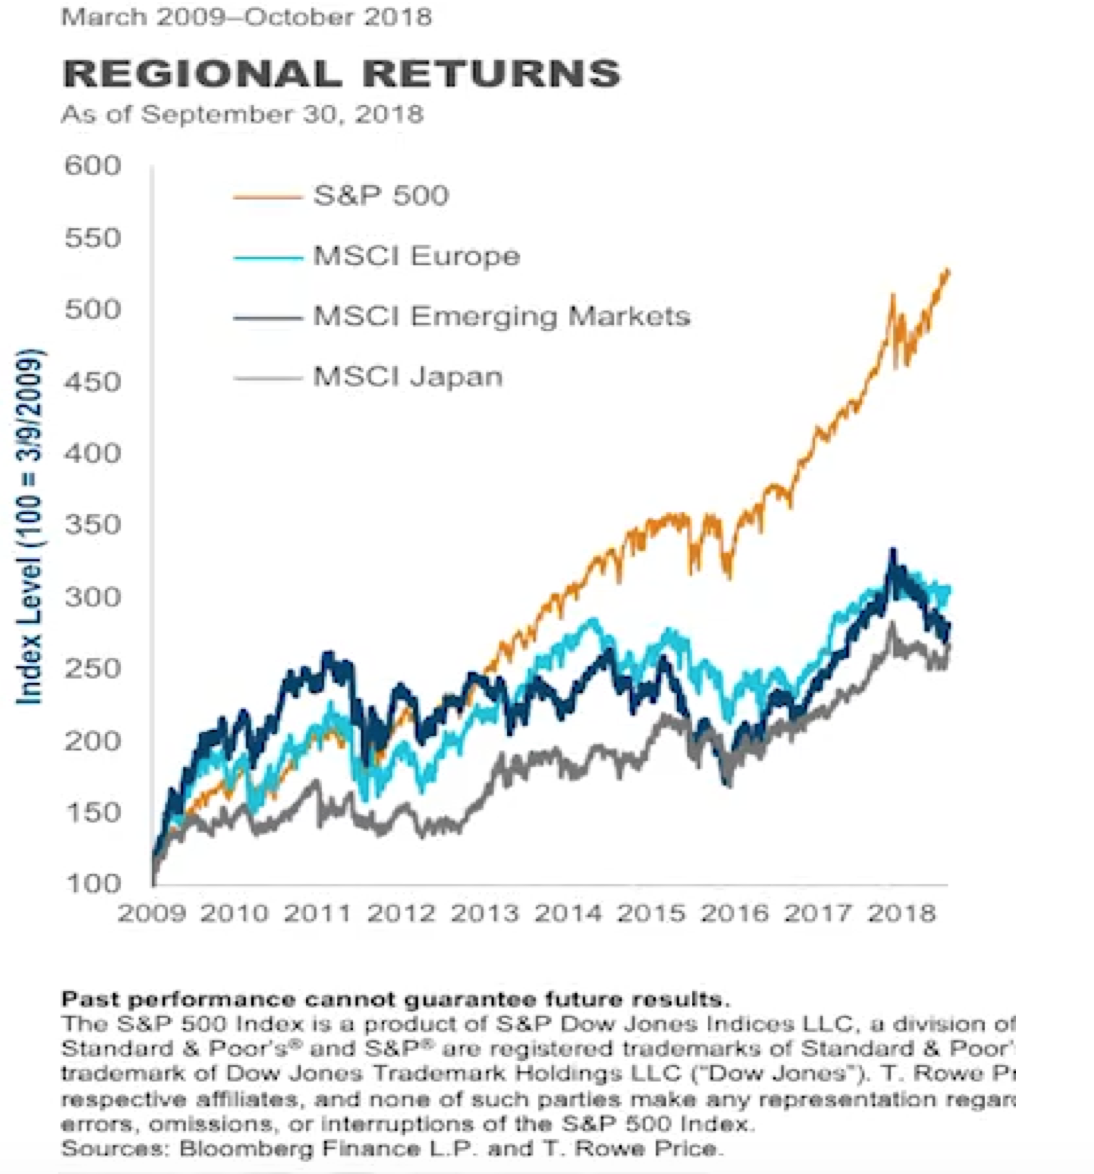
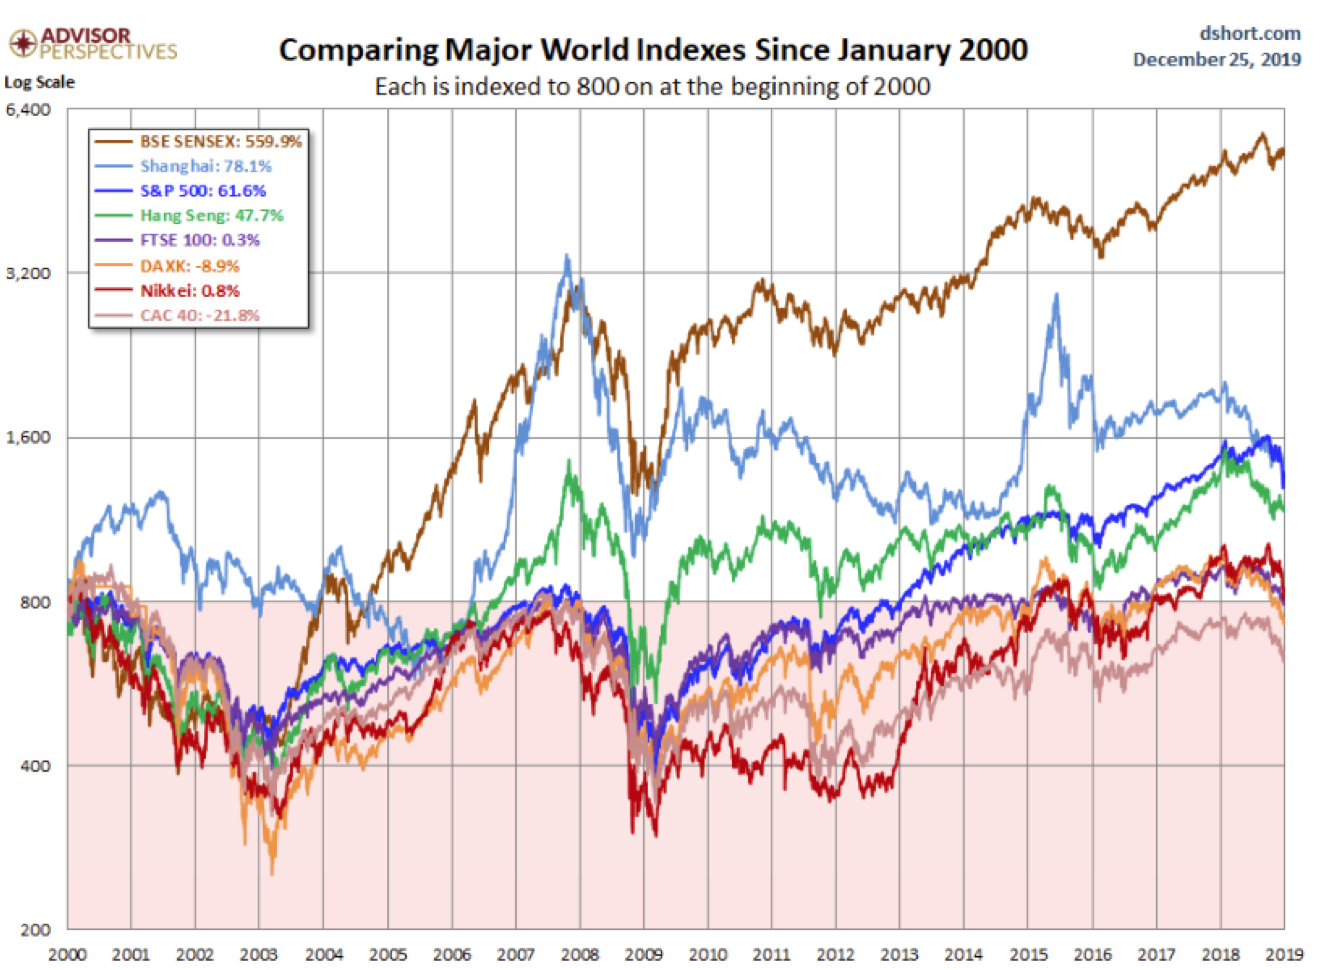
I. Stock markets performance update: 2018 was not a good year
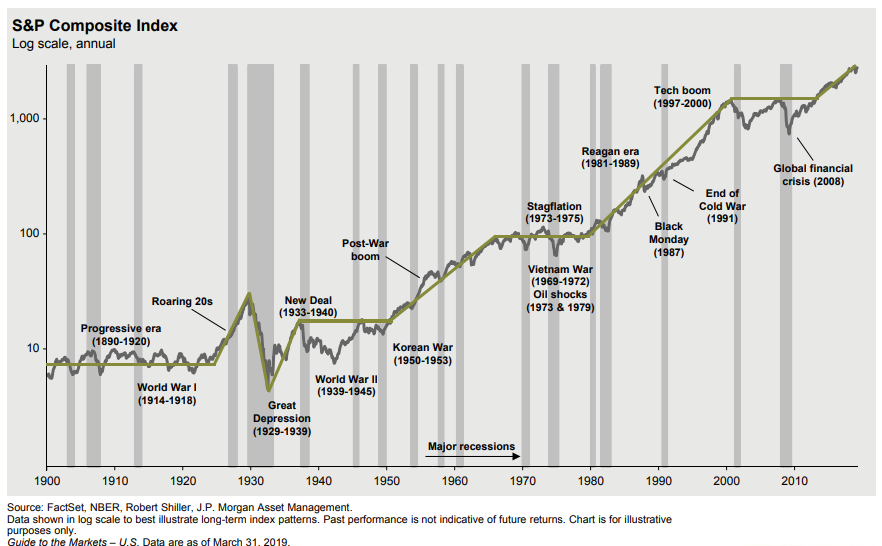
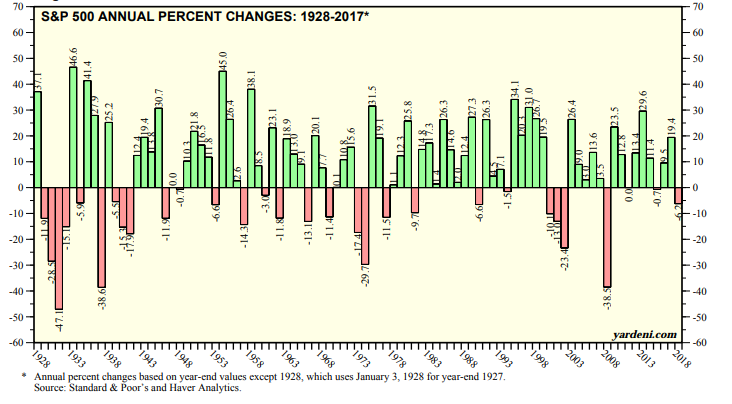
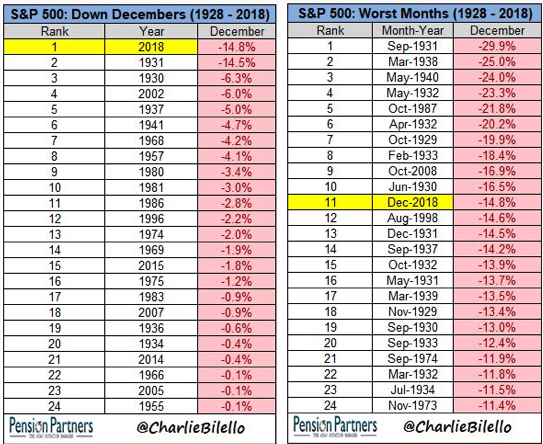
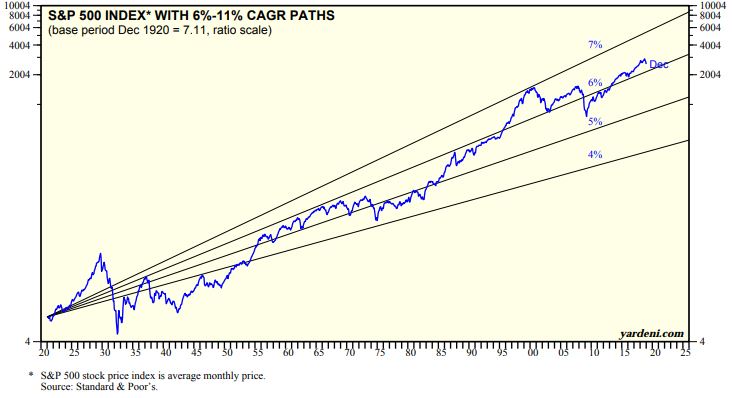
II. U.S. Stocks and the S&P 500 Index: December 2018 was the worst December
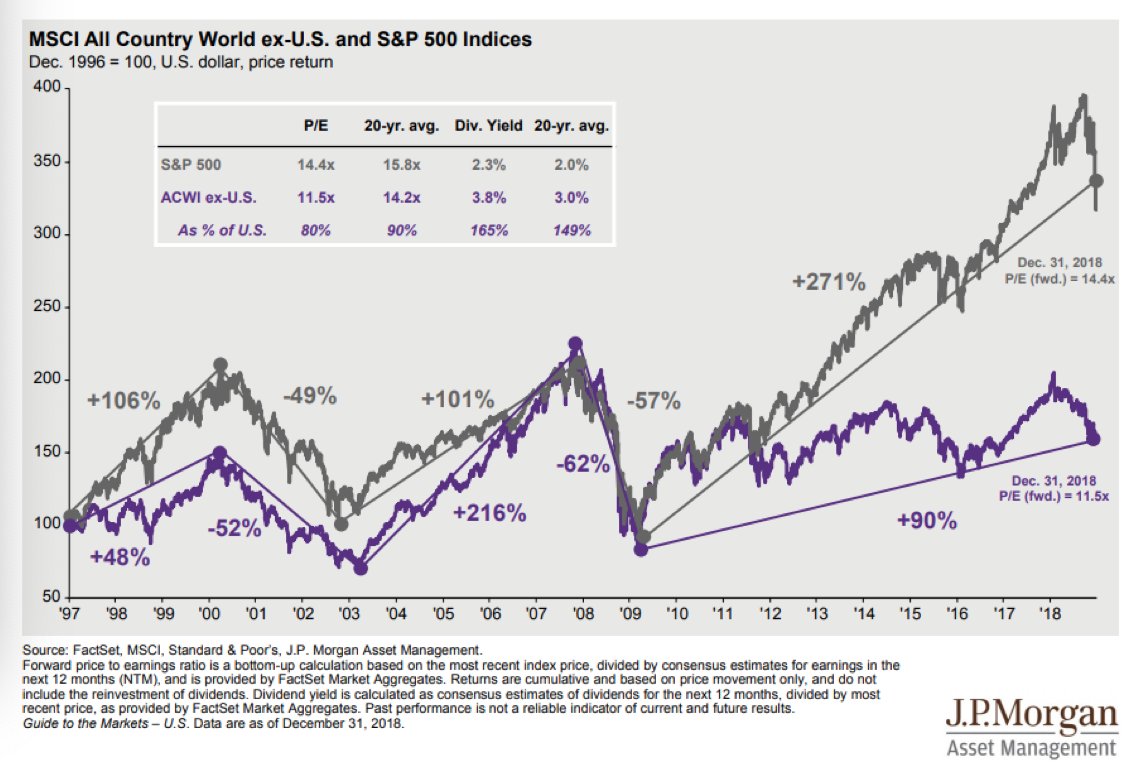
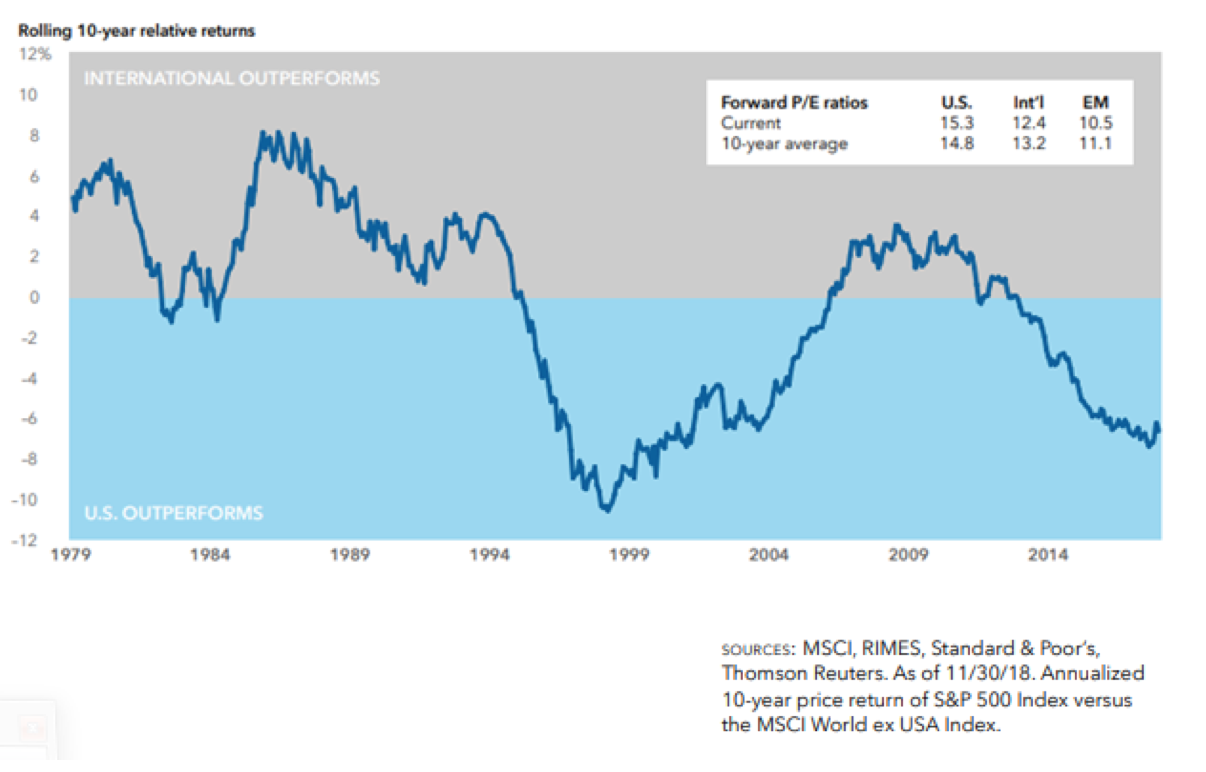
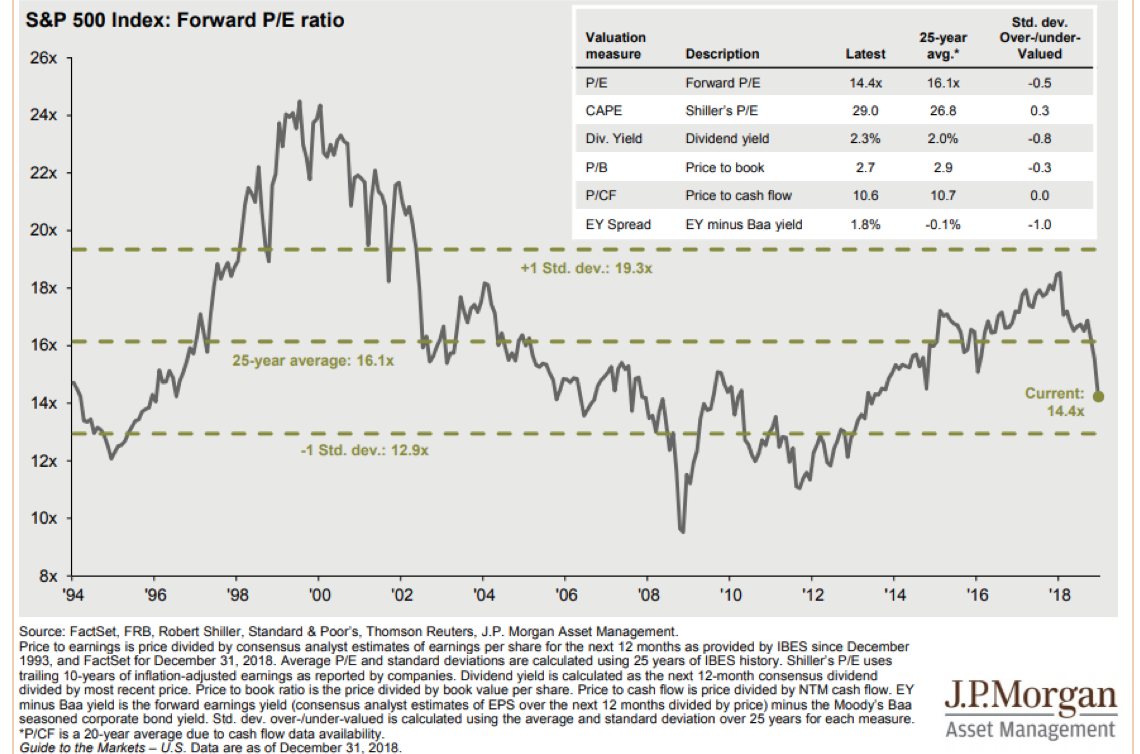
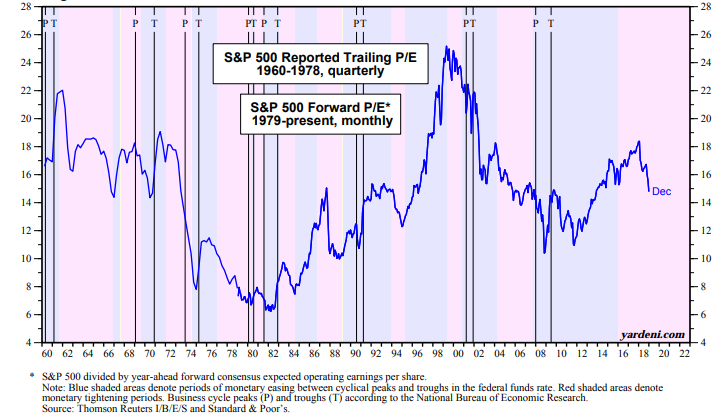
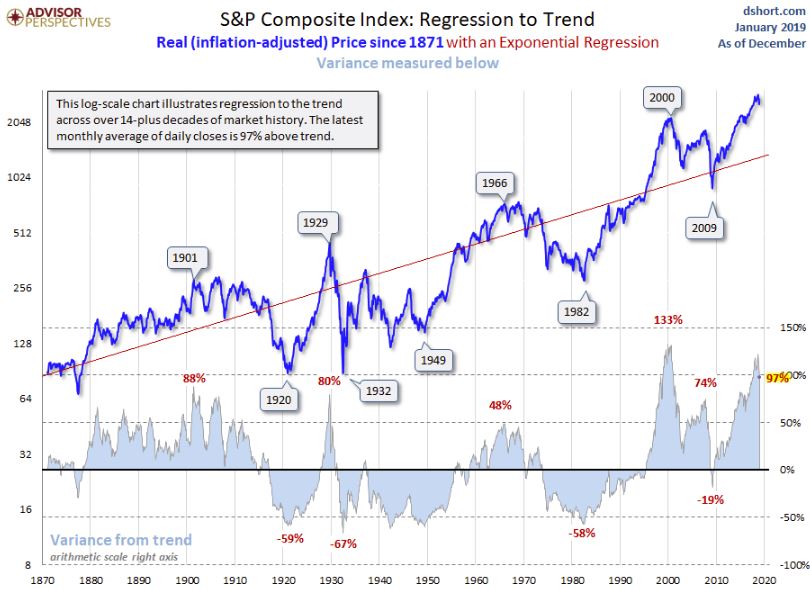
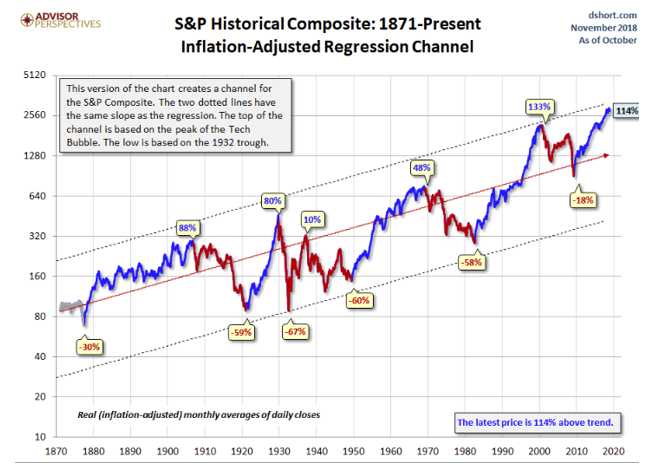
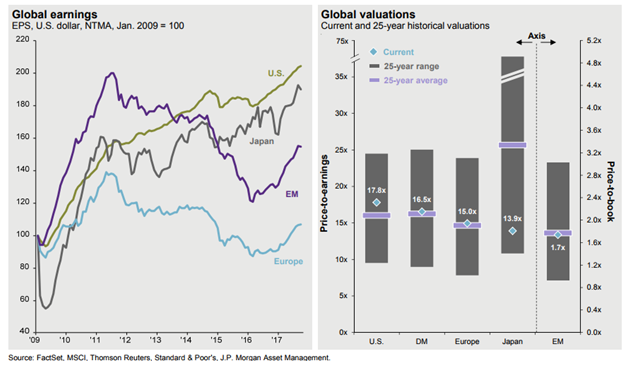
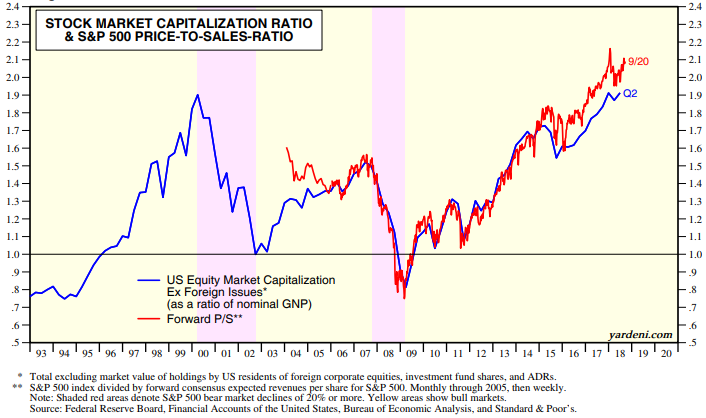
III. Valuations: getting better
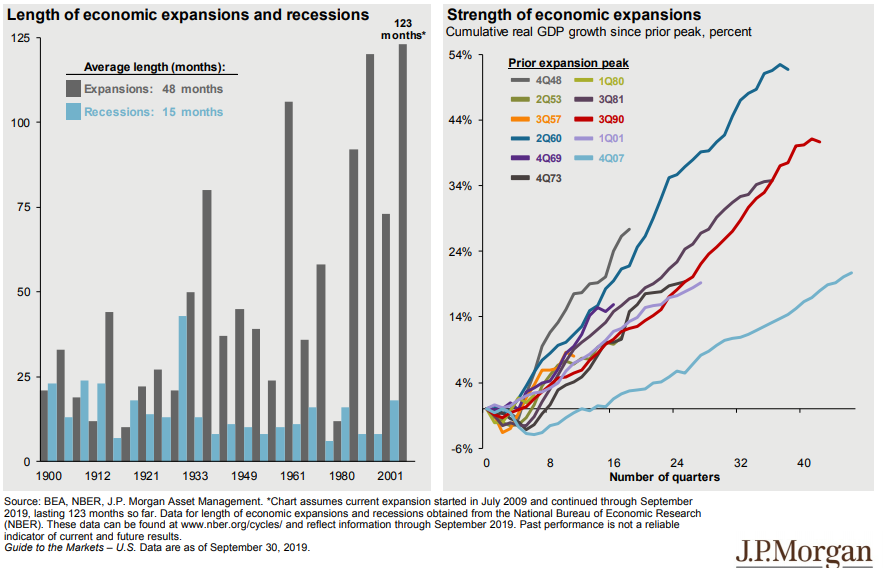
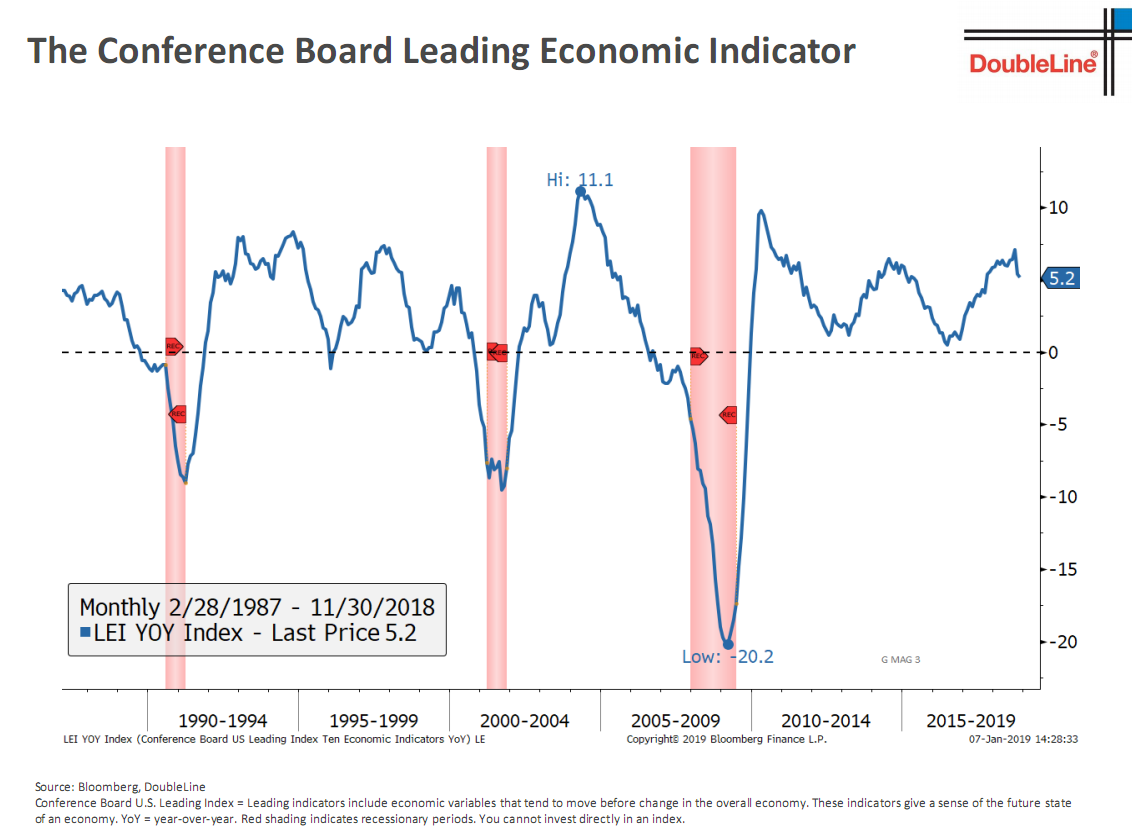
IV. Economy: a recession in 2020-2021?
I. Stock markets performance update: 2018 was not a good year

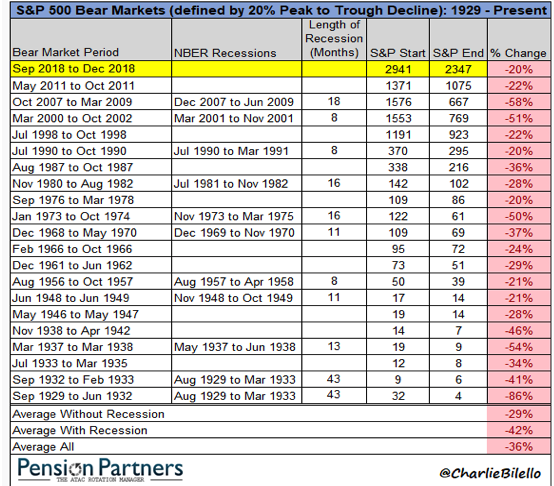
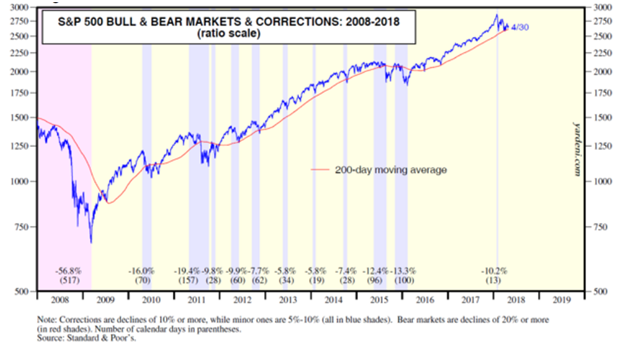
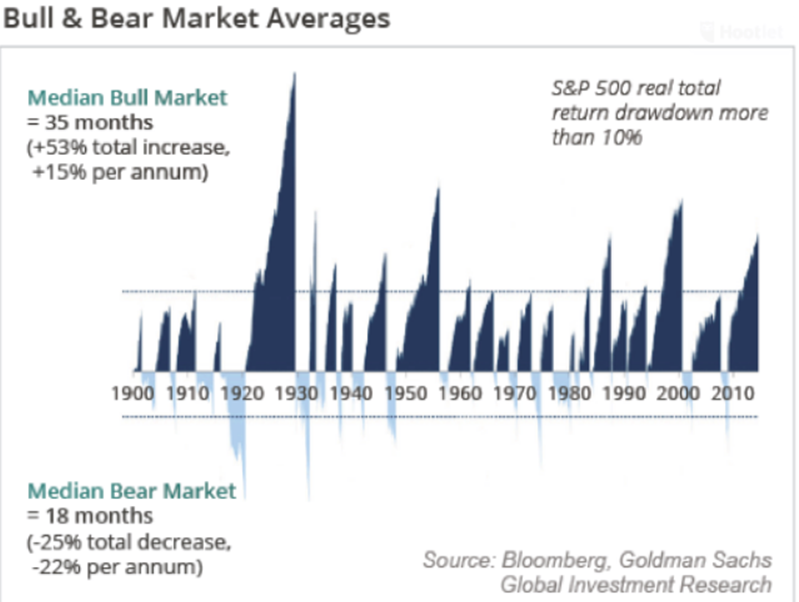
II. U.S. Stocks and the S&P 500 Index: December 2018 was the worst December


III. Valuations: getting better
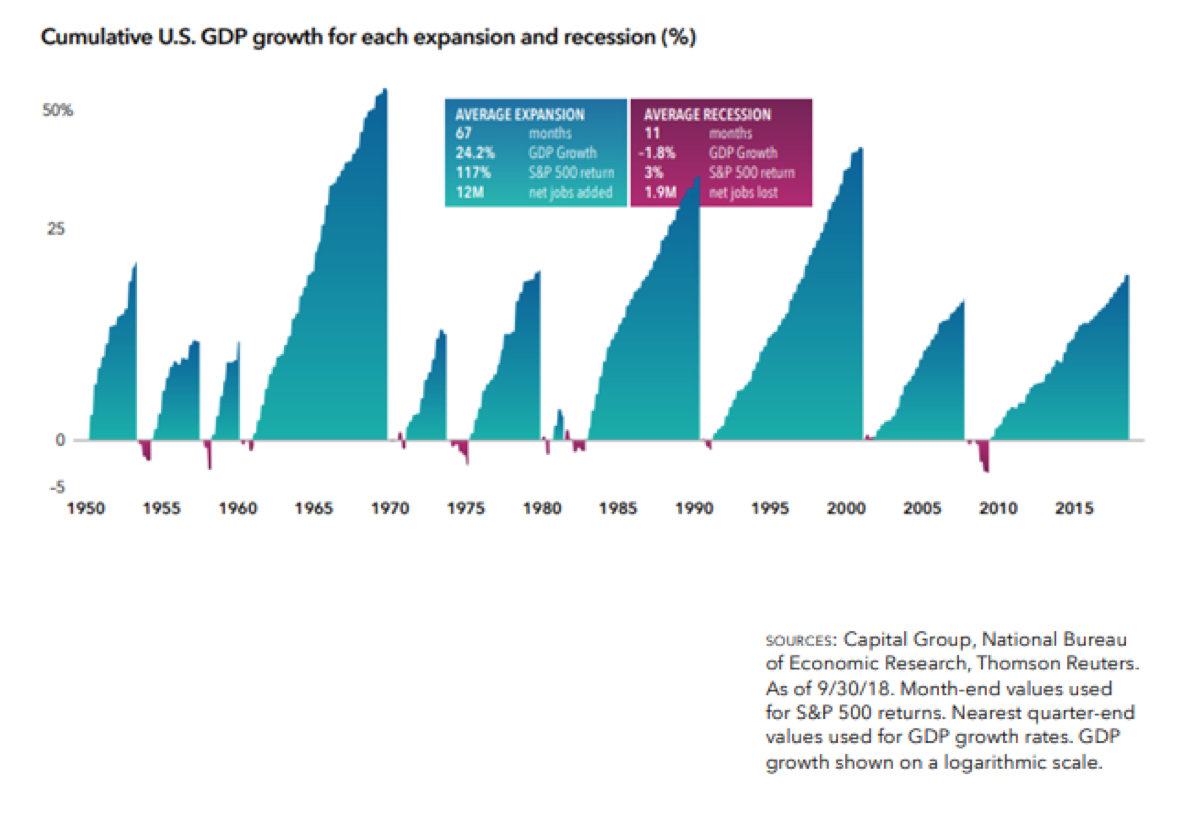
IV. Economy: a recession in 2020-2021?

This newsletter was first published in January of 2019
https://mailchi.mp/bourbonfm/charts_for_better_perspective-1189517?e=3d347df708